Analytics
Who can use this feature?
- Free: Overview tab only. The other tabs stay blurred behind an Upgrade link.
- Basic, Pro & Plus: Every tab.
- Export on the Overview tab needs the Pro or Plus plan, and only admins see the button.
What is Analytics?
Analytics provides comprehensive insights into your customer conversations, AI assistant performance, sales contribution, and FAQs engagement.
Open Analytics from the main menu. It carries five tabs:
- Overview — headline numbers for the whole store
- Human agent — how your team handles conversations
- AI agent — how your AI handles them
- Sales — revenue and orders from conversations
- FAQs — how customers use your self-serve answers
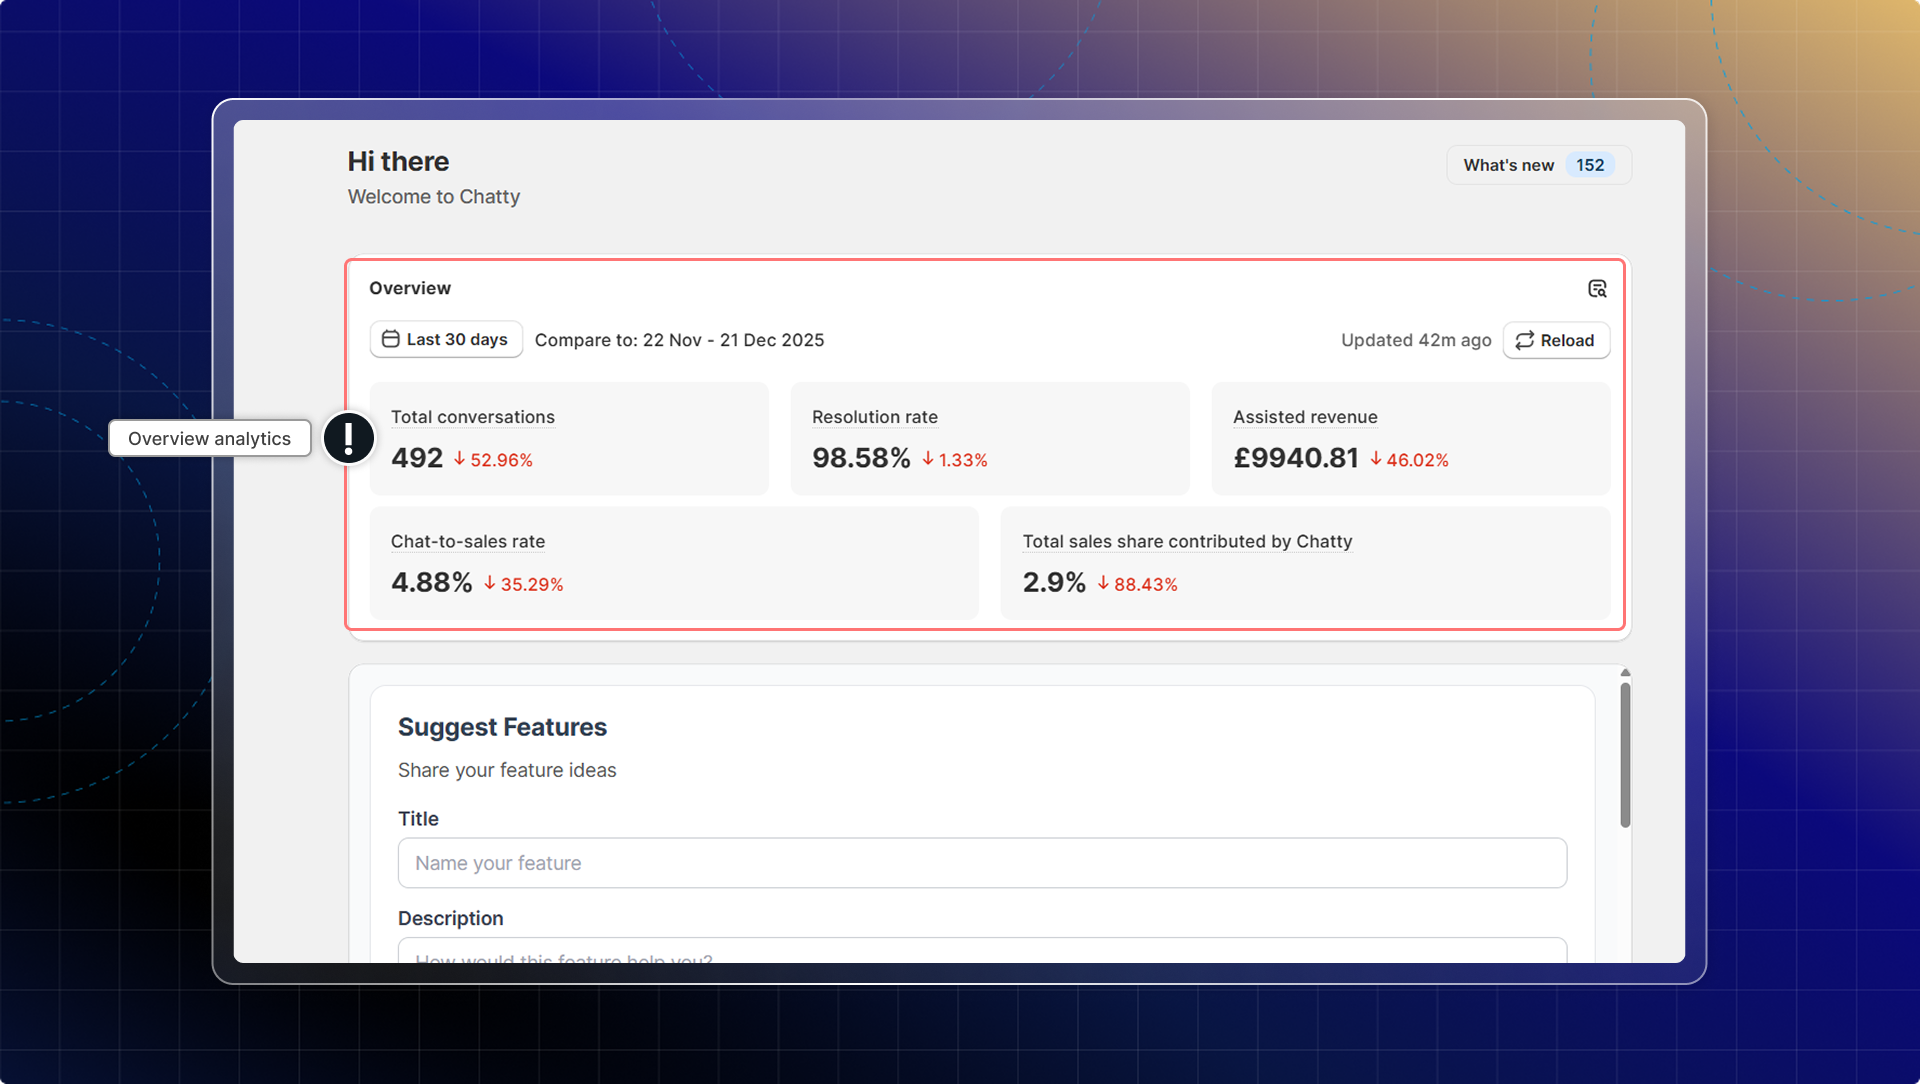
Home also carries a small Overview card with the same headline numbers. The icon on its right opens the full Analytics page.
Set the date range
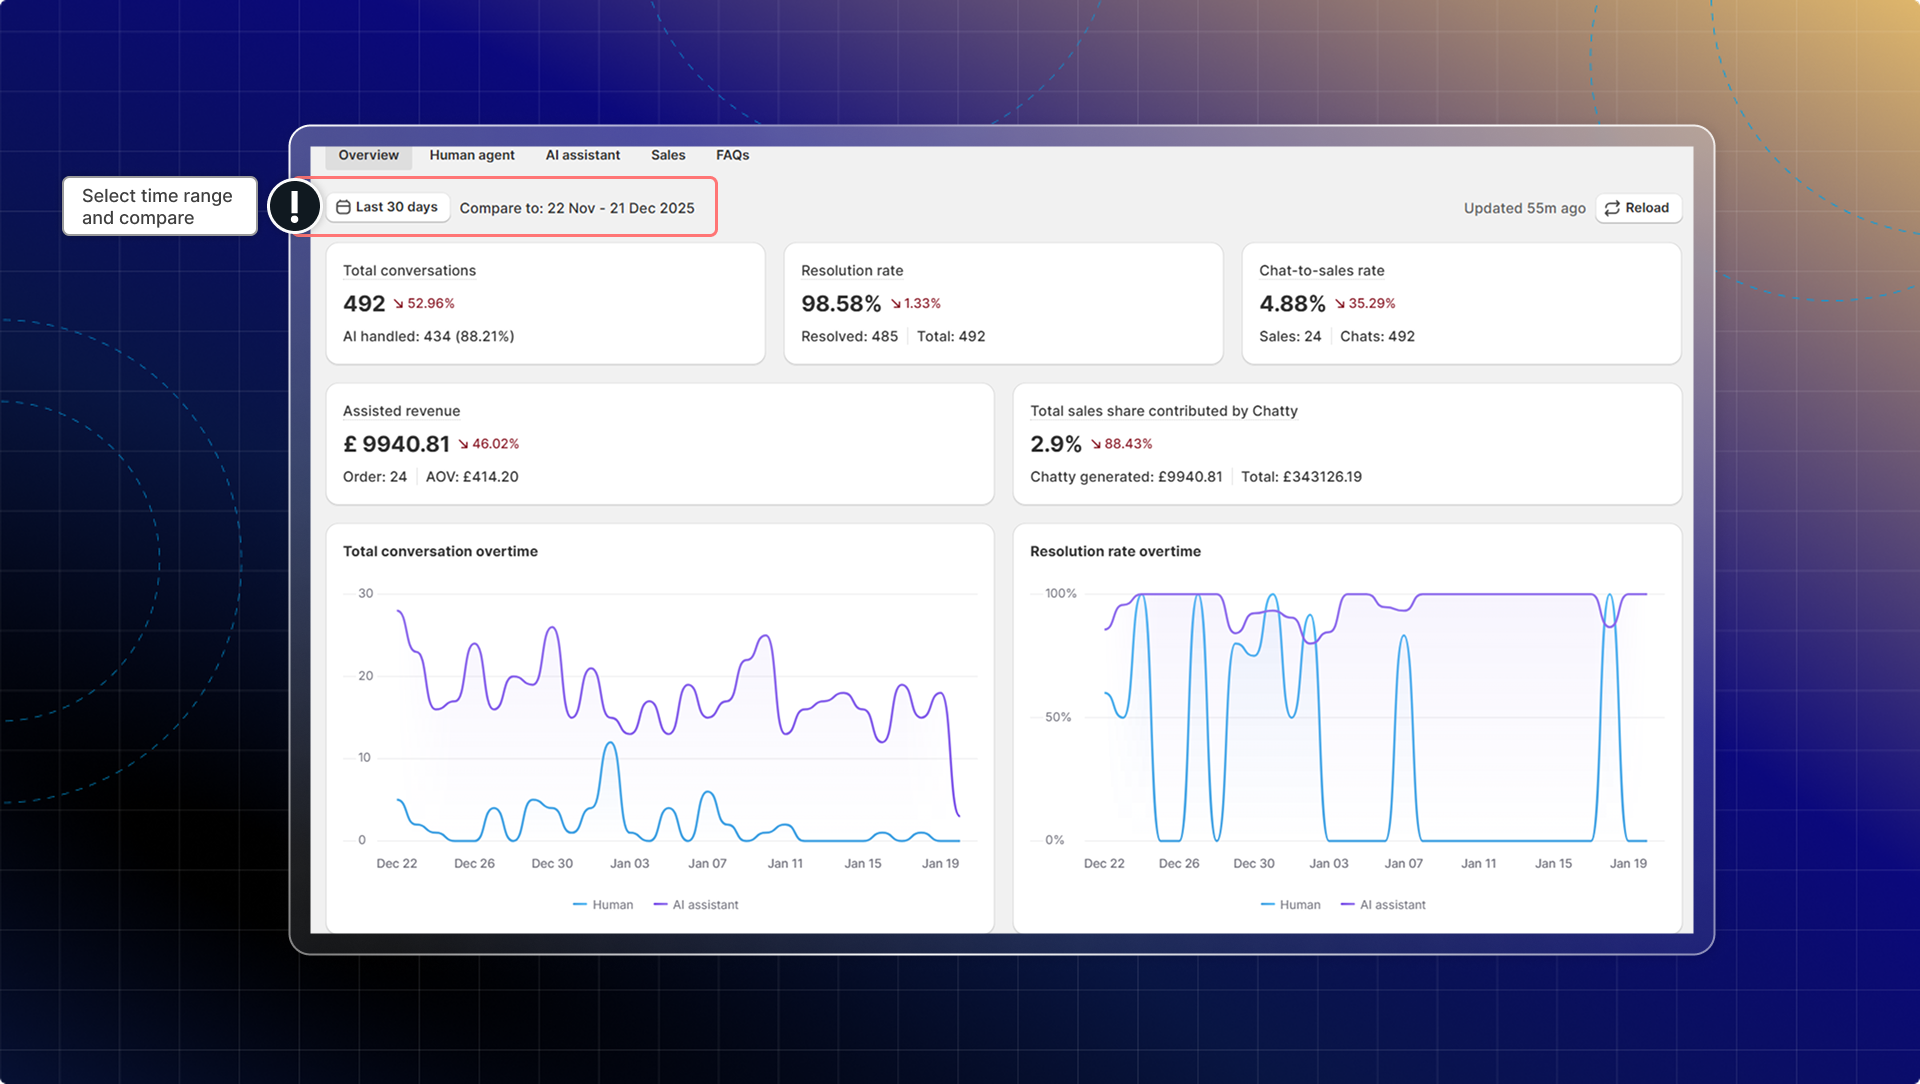
The bar above every tab controls what all the numbers on that tab cover.
- Pick a range: Today, Yesterday, Last 3 days, Last 7 days, Last 30 days, This month, Last month, or Custom time for your own dates.
- Compare to names the period every trend arrow is measured against. Chatty picks the matching period right before yours — you don't set it.
- Updated tells you how old the figures are. Click Reload to pull them again.
Overview tab
| Metric | What it means |
|---|---|
| Total conversations | Total number of conversations. |
| Resolution rate | Percentage of conversations that were resolved. |
| Chat-to-sales rate | Percentage of conversations that generated sales, out of the total number of conversations. |
| Assisted revenue | Total amount of all orders generated from Chatty's conversations. |
| Total sales share contributed by Chatty | Percentage of total store sales that were generated from Chatty conversations. |
Under the cards sits a chart of conversations over time, then two cards side by side.
Conversations by channels splits your conversations across the channels you have connected, as a donut chart.
CSAT reads the post-chat survey your customers answer.
| Metric | What it means |
|---|---|
| CSAT rate | Percentage of customers who reported being satisfied after a conversation. |
| Response rate | Percentage of customers who responded to the satisfaction survey. |
| Average rating | Mean rating across all submitted responses, out of 5. |
| Ratings | Total number of ratings received in this period. |
The card also shows how the ratings split across the five levels, so you can see whether an average is carried by a few very good or very bad scores.
CSAT stays empty until customers answer the survey. Turn it on in Settings → Automation → Satisfaction survey.
Cross-store summary appears at the top of the tab only when more than one store is connected to your account. It lists Open, Resolved and Unread per store, with a total row, so you can see which store needs attention without switching into it.
Export your KPIs
Export pulls the headline numbers into a spreadsheet, for a board deck or a report of your own.
Export needs the Pro or Plus plan. On a lower plan the button carries a Pro badge and clicking it prompts you to upgrade. Team members who aren't admins don't see the button at all.
Go to Analytics → Overview and click Export
The Export AI KPI Data window opens.
Pick the KPIs
Total conversations, Resolution rate, Assisted revenue and Chat-to-sales rate. Pick at least one.
Set the date range
Fill From and To. The range can cover at most 90 days.
Choose the format
Download CSV saves a .csv file. Google Sheets syncs the figures to a spreadsheet — connect your Google Drive first, then set the address to notify when the file is ready.
Click Export now
Human agent tab
Measure your team's performance when handling customer conversations.
| Metric | What it means |
|---|---|
| Total conversations | All conversations involved by human agents in the range. |
| New conversations | Conversations started by customers and taken over by a human agent in the range. |
| Resolved conversations | Conversations marked as resolved by a human agent. |
| First response time | Median time a human agent took to send the first reply. |
| Handling time | Median time a human agent spent handling a conversation. |
| Resolution time | Median time a human agent took to resolve a conversation. |
The three times are medians, not averages. One conversation left open over a weekend won't drag the whole figure.
Team performance details at the bottom breaks the same range down per person, so you can see who carries the load and who needs help.
| Column | What it means |
|---|---|
| Team member | The agent, or Unassigned for conversations nobody took. |
| Handled conversations | Conversations this agent took part in. |
| Resolved conversations | Conversations this agent closed. |
| Average response time | How fast they reply. |
| Handling time | How long they spend on a conversation. |
| Resolution time | How long from picking a conversation up to closing it. |
| Rating | The score customers gave them in the post-chat survey. |
AI agent tab
Show how effectively your AI assistant is handling customer inquiries.
| Metric | What it means |
|---|---|
| AI involvement rate | Percentage of conversations using AI. |
| AI resolution rate | Percentage of resolved conversations using AI. |
| Answer rate | Percentage of questions successfully answered by AI. |
| Time saved | Total time saved by using AI. |
Customer feedback counts the thumbs customers gave the AI's replies.
| Metric | What it counts |
|---|---|
| Total response | All AI replies in the range. |
| Great | Replies rated with a thumbs up. |
| Good | Replies nobody rated. |
| Bad | Replies rated with a thumbs down. |
Use Go to inbox on that card to read the conversations behind a bad score.
Common intents lists what customers actually ask, with Total question and Success rate per topic. A topic with high volume and a low success rate is the next thing to train — see Train your AI.
Customer intents
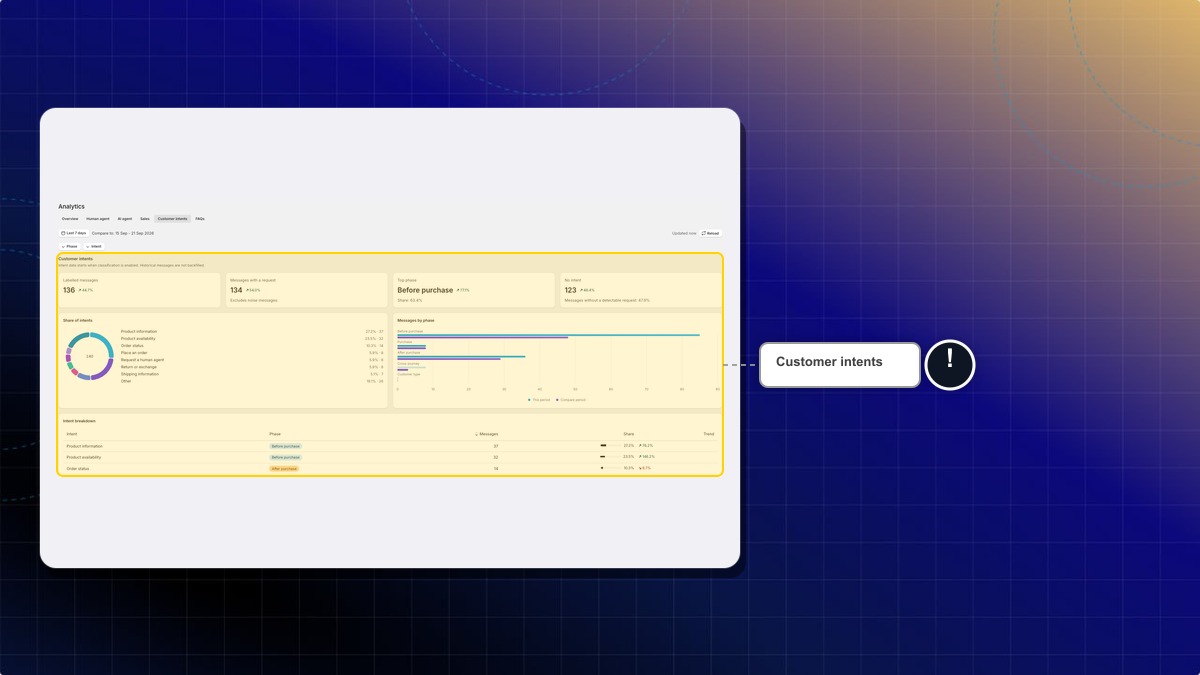
Chatty tags each customer message with the intent behind it, from browsing to after purchase.
- Go to Analytics → Customer intents.
Expected result: The tab shows Share of intents, Messages by phase, and Intent breakdown.
Numbers on this tab start when classification is on. Older messages are not added later.
The same tags appear on customer messages in Inbox. In Contacts, filter by Intent. Spam and out-of-office replies are marked Noise.
This report sits with the other advanced reports. A plan that does not include it shows Upgrade to unlock advanced report.
Sales tab
Understand how customer conversations contribute to your store revenue. The Sales tab is the Chat-to-Sales dashboard. It carries the revenue KPIs, the funnel, topic attribution and your team's performance.
Learn more in Chat-to-Sales.
FAQs tab
Track customer engagement with your self-service content and identify which questions matter most.
| Metric | What it means |
|---|---|
| Published FAQs | Total number of published FAQ articles. |
| Total views | Total number of clicks on all questions. |
| FAQ views over time | View trends, to see when customers reach for your FAQs. |
| Top viewed FAQs | Your most popular FAQ content. |
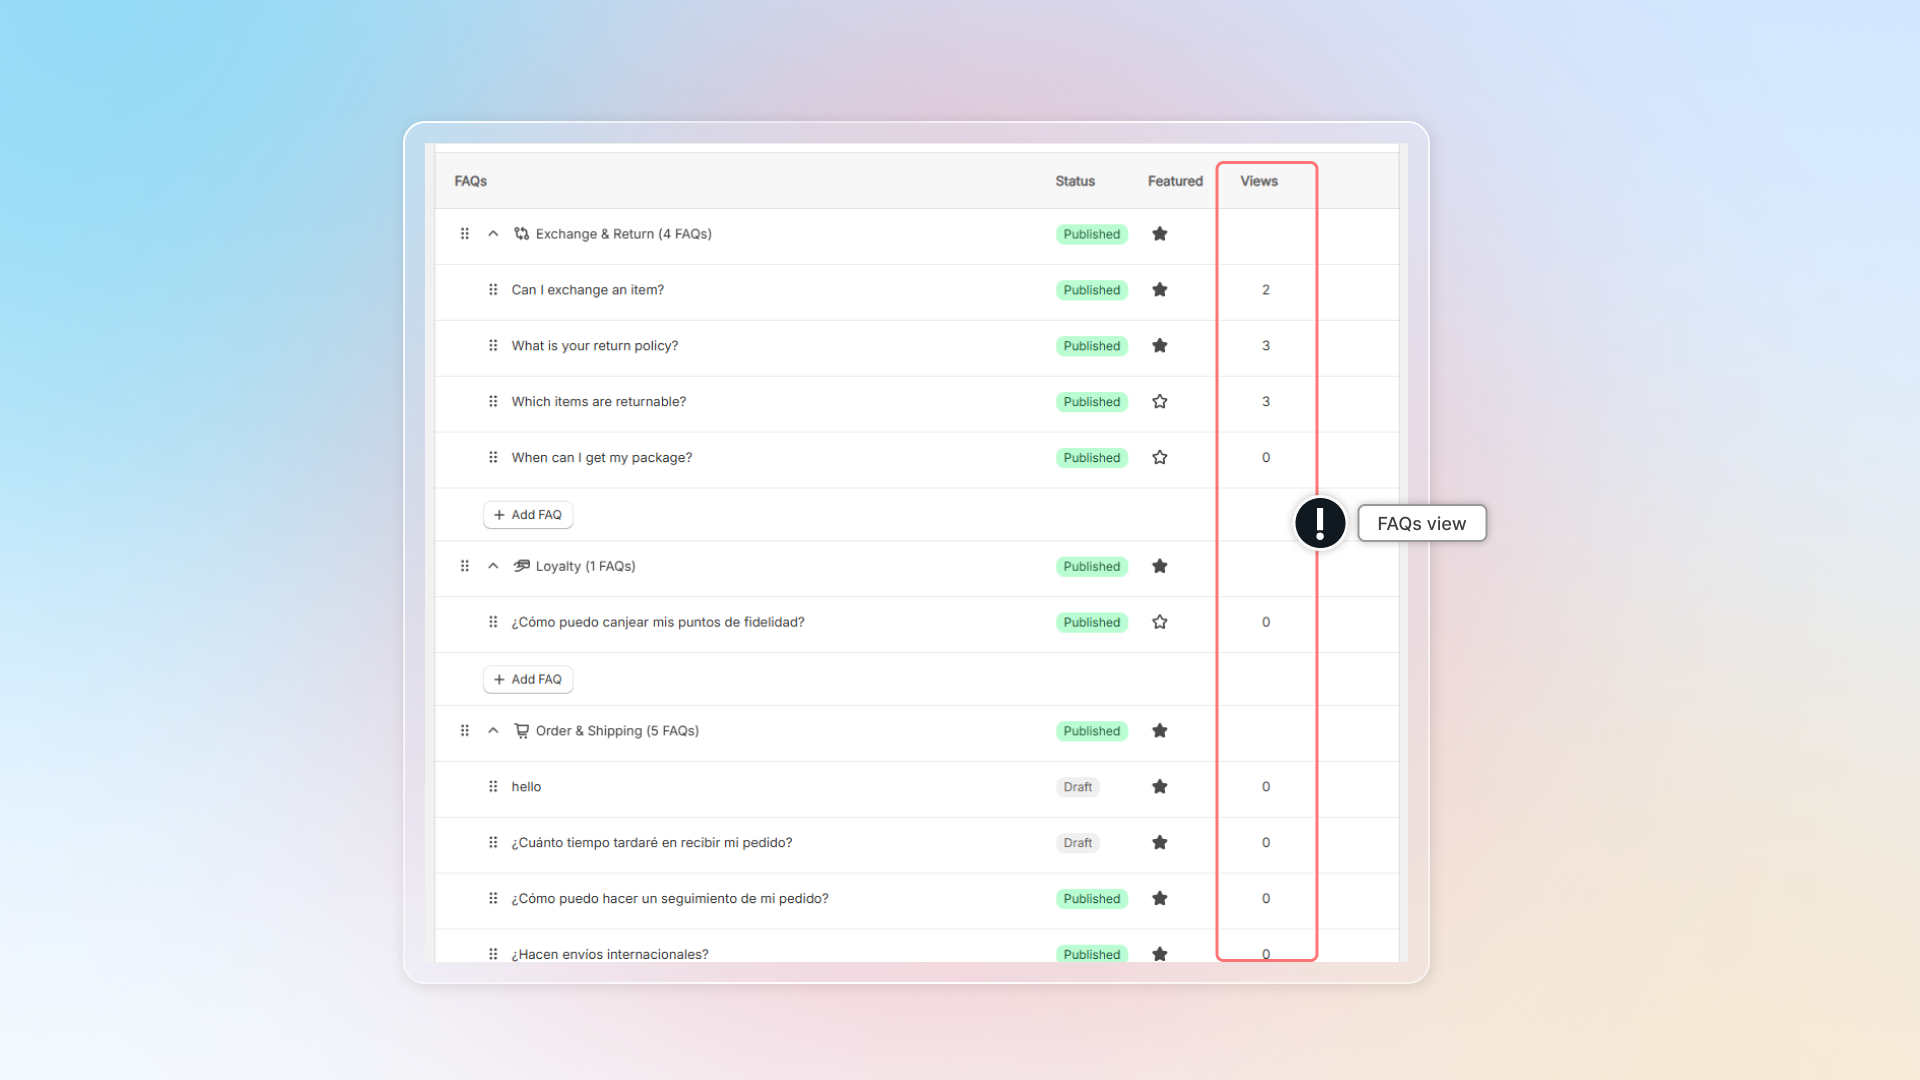
A view is counted each time a customer clicks to expand an answer — on the FAQs page, in an FAQs block, or inside the chatbox.
To see the count for a single question, go to FAQs and read the number next to it.
 Chatty Help Center