Chat-to-Sales
Who can use this feature?
- Free: Overview tab only. The Sales tab stays blurred behind an upgrade prompt.
- Basic: The full dashboard, with the summary numbers and the funnel.
- Pro & Plus: Adds the detailed breakdowns you act on.
What is Chat-to-Sales
Chat-to-Sales is the Sales tab in Analytics. It shows how your conversations turn into revenue.
It also separates the revenue your AI drove from the revenue your team drove. This helps you see which side to invest in.
- Go to Analytics.
- Click the Sales tab.
Expected result: The dashboard opens with the KPI banner on top and the breakdowns below.

Use the date picker on the left to set the range. Compare to shows the period the trends are measured against. Click Reload to pull fresh data.
What the KPI banner shows
The banner summarises the range you picked. Each card carries a trend against the previous period.
| Card | What it means |
|---|---|
| Chatty-assisted revenue | Total assisted revenue generated from Chatty's conversations. |
| Orders | Number of assisted orders tracked in the selected date range. |
| AOV | Average assisted revenue per order. |
| Chat-to-Sales rate | Percentage of conversations that generated sales, in the view you picked. |
| Resolution | Percentage of conversations that were resolved, in the view you picked. |
| Human-touch | Percentage of conversations involved by a human agent. |
| CSAT | Percentage of customers who reported being satisfied after a conversation. |
Each card also prints the raw figure underneath, such as 186 / 2,105 store orders. This is how you compare Chatty against your whole store.
How to get a one-line summary
- Go to Analytics → Sales.
- Set your date range.
- Click Both, AI, or Staff.
- Click Summarize.
Expected result: A banner opens above the tables with one sentence, for example:
Over 11 Aug - 17 Aug 2026 (AI), Chatty assisted 0 orders worth $0, a 0.00% chat-to-sales rate, 50.00% resolution.
Close the banner with the X on its right.
The sentence reads the same figures as the cards above it. A card showing a dash is left out.
How to split the numbers by AI or staff
- Go to Analytics → Sales.
- Click Both, AI, or Staff above the banner.
Expected result: Every card and table on the page reloads for that view.
Human-touch shows under Both only. It measures the whole store, so it would read the same under AI or Staff.
How to read the Sales breakdowns
The Sales view sits under the banner. It answers where the revenue came from.
Funnel by phase
Every conversation sits in exactly one phase, decided by the order behind it.
| Phase | What it covers |
|---|---|
| Pre-purchase | No chat-attributed order yet. Covers shoppers still deciding, and customers asking about orders placed elsewhere. |
| Purchase | Has a chat-attributed order that is not fulfilled yet. |
| Post-purchase | Has at least one chat-attributed order fulfilled. |
The All phases row at the bottom totals the three.
Topic attribution
Shows which conversation topics bring in the most revenue.
| Topic | Typical conversation |
|---|---|
| Product suggestions | The shopper asks what to buy. |
| FAQs | The shopper asks something your FAQs answer. |
| Promotion / voucher | The shopper asks about a discount or code. |
| Order tracking | The customer asks where their order is. |
| Return / refund | The customer wants to send something back. |
| Other | Anything that fits none of the above. |
Volume by phase
The chart under the tables plots conversation volume against conversion rate. Switch it between By phase and Over time.
Details panel
Click any funnel or topic row. The panel on the right opens with the numbers behind that row.
- Conversations, Orders, AOV and Fulfillment rate for the row
- Conversations across the last 4 periods
- AI vs agents for the same period
- Breakdown by topic
Top products
Shows the products that sell most through chat, as a table and a chart.
How to review your team
Click Operations & Team next to Sales.
Expected result: The view opens with the Conversation resolution cards and the agent table, for the same date range.

Conversation resolution
Five cards split every conversation in the range by how it ended.
| Card | What it counts |
|---|---|
| AI resolved | Closed by the AI alone. |
| Agent resolved | Closed by a human agent. |
| Mixed resolved | Both the AI and an agent took part. |
| No-reply resolved | Closed without anyone replying. |
| Open | Still open at the end of the range. |
Agent table
| Column | What it means |
|---|---|
| Chats | Conversations this agent handled. |
| Orders | Assisted orders from those conversations. |
| Closed by agent | Share of their chats they closed themselves. |
| FRT | Median first response time on chats they replied to. |
| ≤5m % | Share of their replies sent within 5 minutes. |
| Participation | Their chats over your total store conversations. |
Click an agent to open Details on the right. You get their headline numbers, their Work mix by phase and topic, and a Vs team average comparison.
How to show Chatty revenue in Shopify Analytics
You can keep Chatty's revenue as a report in Shopify Analytics, next to your other store reports. Shopify works out the money from your real orders.
Before you start, make sure:
- Chatty has permission to update your orders. Chatty marks each order it assisted with the Chatty Assisted field, and the report reads that field. Learn more in Chatty attribution in Shopify.
- The date range you pick in Chatty has some Chatty-assisted revenue. With no assisted revenue, the banner does not appear.
-
Go to Analytics → Sales.
-
Find the Show this revenue in Shopify Analytics banner under the KPI banner.
-
Click Open in Shopify.
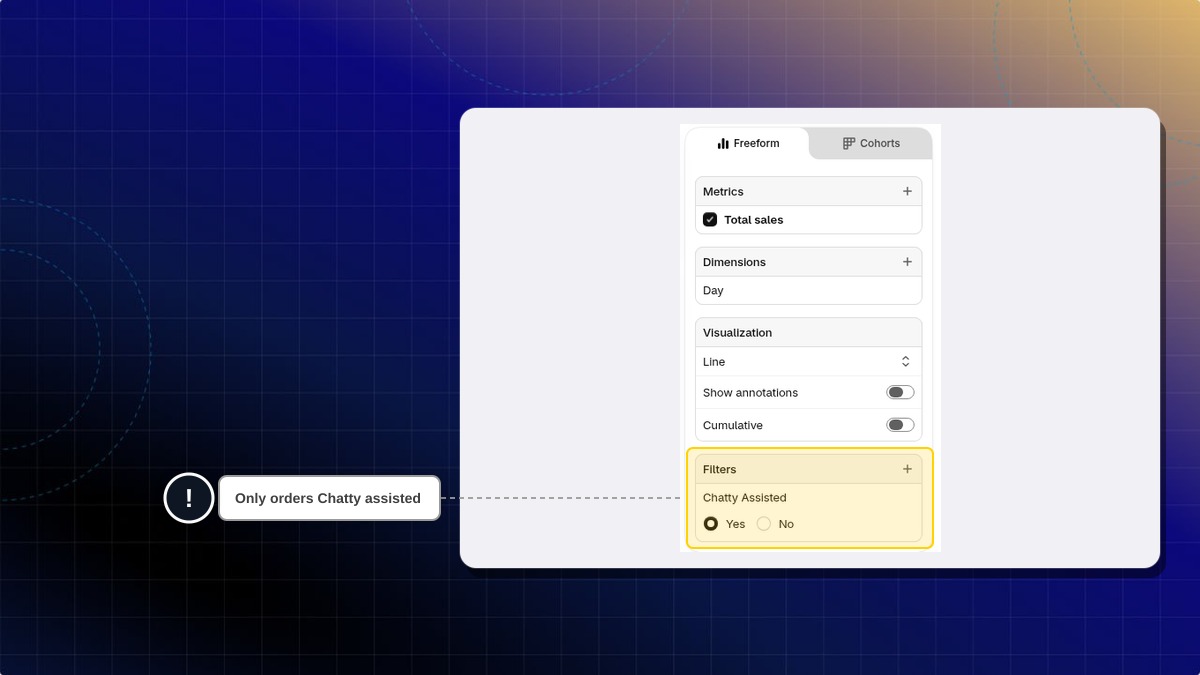
Shopify's report editor opens in a new tab with the report ready. The Chatty Assisted filter is set to Yes.
-
Click Save at the top. If Save doesn't show, change any filter first.
-
Name the report, for example
Revenue from Chatty.
Expected result: The report stays in Shopify Analytics, so you can open it any time without going through Chatty.
What the report shows
| Part | What it means |
|---|---|
| Total sales | Shopify's total sales for orders marked Chatty Assisted. |
| Day | One point per day for the last 7 days. |
| Second line | The 7 days before, so you can see the change. |
| Currency | Your store currency. |
Change the dates with Shopify's date picker at the top of the report.
The banner always uses revenue from both the AI and your team. It shows the same way whether you picked Both, AI, or Staff.
What each plan unlocks
Every paid plan opens the dashboard, and the summary numbers are always there. The detailed numbers, the ones you act on, sit on Pro & Plus.
| Basic | Pro & Plus | |
|---|---|---|
| All six Analytics tabs | Yes | Yes |
| KPI banner, every card | Yes | Yes |
| Funnel by phase, every column | Yes | Yes |
| Topic attribution: Topic, Volume, % | Yes | Yes |
| Topic attribution: Orders, AOV, Rate, Trend | Locked | Yes |
| Details panel: headline numbers and trend | Yes | Yes |
| Details panel: AI vs agents, topics, products sold, discounts | Locked | Yes |
| Top products table | Fewer columns | Every column |
| Top products chart | Locked | Yes |
| Operations & Team: agent, chats, orders | Yes | Yes |
| Operations & Team: closed by agent, response times, participation, work mix | Locked | Yes |
A locked block stays on screen behind a blur. It carries an Upgrade to unlock label and an Upgrade plan button.
Why did Human-touch disappear from the banner?
You switched the banner to AI or Staff. Human-touch is a store-wide number, so it only shows under Both.
Why does Operations & Team say "No agent activity in this period"?
No human agent joined a conversation in the range you picked. Widen the date range, or check the Human-touch card to confirm.
Why is my revenue here lower than my Shopify revenue?
This page only counts orders Chatty was involved in. Each card prints that figure against your store total underneath, so you can compare the two.
Why does Shopify show a different amount than Chatty-assisted revenue?
The two numbers are counted in different ways.
- Chatty records the order total when the order is placed. Shopify applies its own rules to total sales, for example it takes returns off later.
- Shopify only counts orders that carry the Chatty Assisted field. Orders placed before Chatty could update your orders don't have it.
- The Shopify report opens on the last 7 days. Set the same dates on both sides before you compare.
 Chatty Help Center